
CrashDash 30km/h Analysis
“The evidence for 30km/h zones has never been stronger, and tools like CrashDash make that evidence accessible to the people who need it most — advocates, community groups, and local champions pushing for safer streets.”
Using Crash Data to Make the Case for 30km/h Zones: A Fitzroy & Collingwood (Victoria) Case Study
The debate about 30km/h zones often gets stuck on assumptions about travel times, driver frustration, and whether slower speeds actually make a difference. But what if you could show your council or community the evidence of exactly what happened in a nearby suburb after they dropped the speed limit?
The inner city Melbourne suburbs of Fitzroy and Collingwood introduced a 30 km/h speed limit in May 2024. CrashDash, a new Australian crash data visualisation tool, was able to easily analyse the area in which the lower speed limit was introduced, looking at the data before and after implementation.
The numbers tell a clear story
In the 12 months before the new speed limit was introduced (May 2023–May 2024), there were 40 crashes in the area, of which, 13 were serious injuries.
In the 12 months after the implementation (May 2024 - May 2025) 33 crashes, of which 5 were serious injuries.
That's a 62% reduction in serious crashes. One suburb. One year. One speed limit change.
The people most at risk saw the biggest benefit
Here's the part that matters most: crashes involving people walking and riding a bike decreased. These are the road users with no protection if something goes wrong - and the ones who saw the biggest safety gains from slower speeds.
The mode split barely changed across the two periods. The number of people walking, riding bikes, driving cars and riding motorcycles were all using the streets in roughly the same proportions. So this isn't a story about fewer people being on the streets. It's a story about saving lives and reducing the number of people being seriously injured when a crash occurs at 30km/h instead of 50km/h. Physics doesn't negotiate when it comes to causing harm in a crash.
Why this matters for advocacy
If you're making the case for 30km/h zones in your area, this is the kind of local, time-specific evidence that changes conversations. Instead of debating theoretical safety benefits, you can show councillors and community members what actually happened in a real Australian suburb with similar streets and similar traffic patterns.
CrashDash makes this analysis accessible to anyone. The platform is free to use and covers crash data across Australia. You can:
Draw a boundary around any area you're advocating for (a suburb, a school zone, a high street)
Set your date ranges to compare before/after periods
Export the stats and visuals for reports, presentations or social media
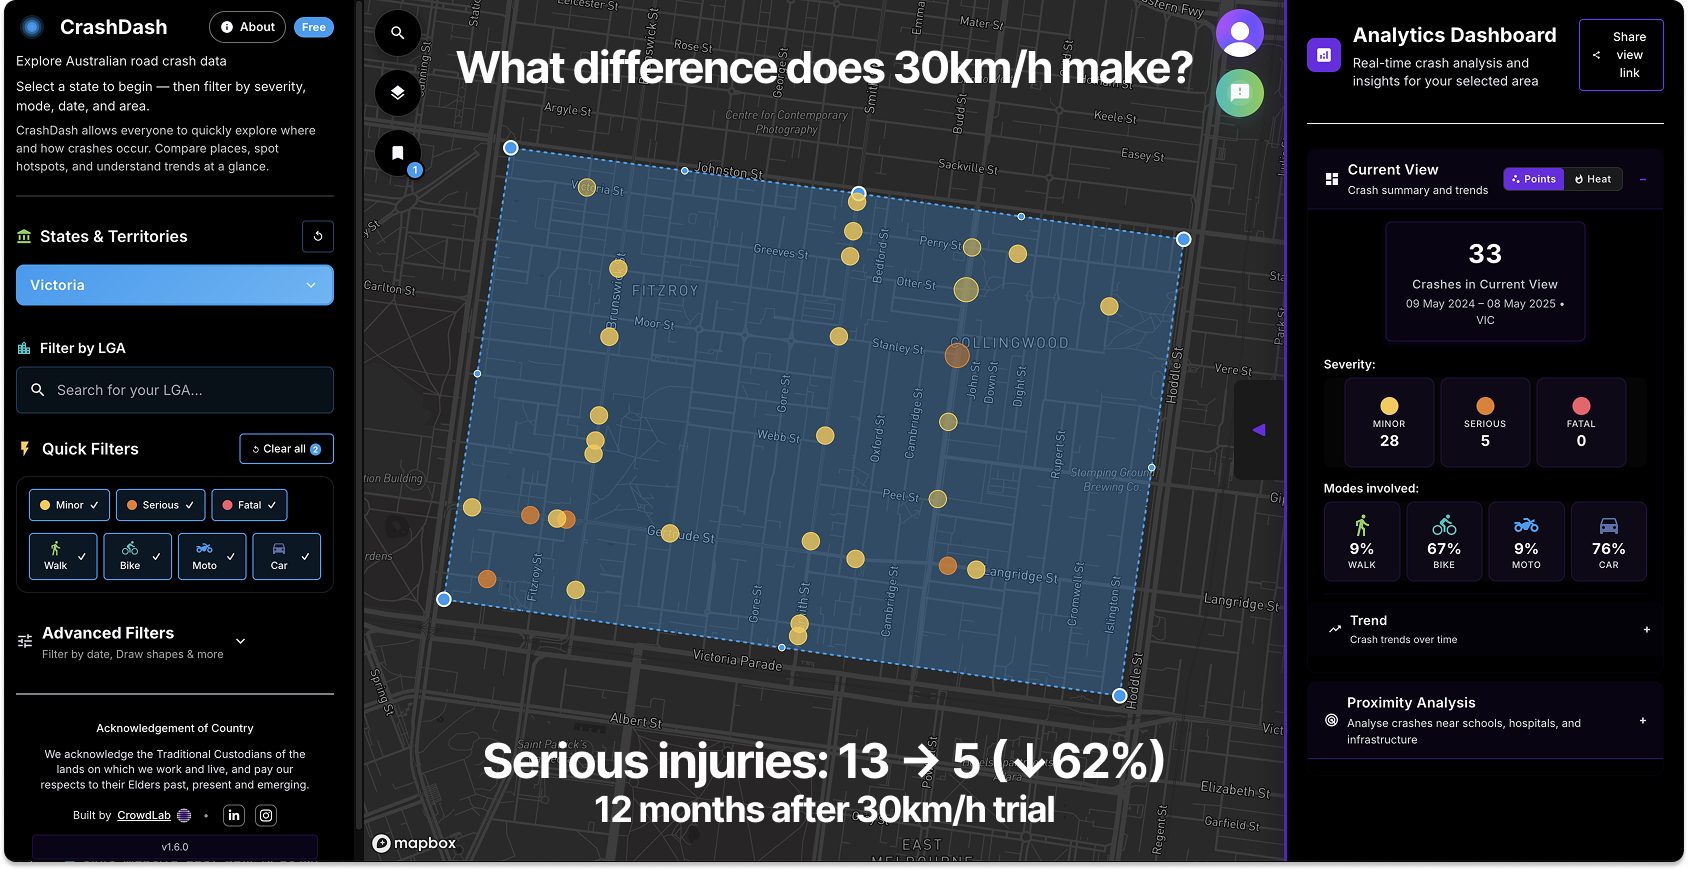
A screenshot of the CrashDash tool.
The Fitzroy/Collingwood analysis took about 30 seconds to run.
Getting started
The evidence for 30km/h zones has never been stronger, and tools like CrashDash make that evidence accessible to the people who need it most — advocates, community groups, and local champions pushing for safer streets.
Want to try it for your area? Visit CrashDash and start exploring. The data is there, it's local, and it's ready to use.